We will be solving practical challenges through MBA concepts. No theory only applications!

1. What is the value of your input at which your business can hit maximum profits?
Q: The input (or quantity to produce) leads to output (revenue). The manufacturing head or ecommerce head might have asked you what is “that” input quantity value at which we can maximize profits? If your boss doesn’t think like that, there is a scope for your promotion: p
A: There is a science to it and a little bit of Math (don’t get scared). We all know that Profits= Revenue- Costs. To get maximize profits, you need to take 1st degree differential and equate to 0. Right ?
(If not, please stop and recall high school Maths )
Meaning 0= dR-dC, whereby differential or marginal costs (MC)= marginal revenue (MR) is the condition at which we can maximize profits. Marginal cost is the increase in cost by producing one more unit of the good while marginal revenue is the change in total revenue as a result of changing the rate of sales by one unit.
Ok that’s it. No more Math. What does the above mean in business language ? Think of the opposite of the above condition, what if MR is not = MC, then:
If, MC < MR, then for each additional unit produced, revenue will be higher than the cost so that you will generate more.
Else, MC > MR, then for each extra unit produced, the cost will be higher than revenue so that you will create less.
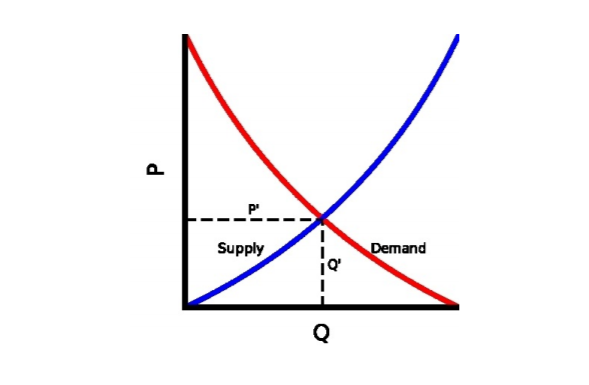
Read above sentences twice more and slowly. It shall hit you. Now what ? Go and get the cost and revenue equations (like the red and blue lines) from your manufacturing heads.

The equation when plotted can look something like legendary chart on left. The blue line (cost) states that as the price of a good/service goes up, its quantity supplied increases. Similarly, the red line(revenue) states that as the price of the good/service goes up, its quantity demanded decreases.
There is very high likehood especially in bigger firms that the graph exists. If not, you can try creating one. Please do a first order differential and you are good to go. Don’t lose intuition, that should always drive the science and not the other way round !
2. How to get confidence in an interval?
Q: So your boss asked how confident are you in the mean value reported from your sample survey ?
A: We have the answer to this question.Lets do some confidence building

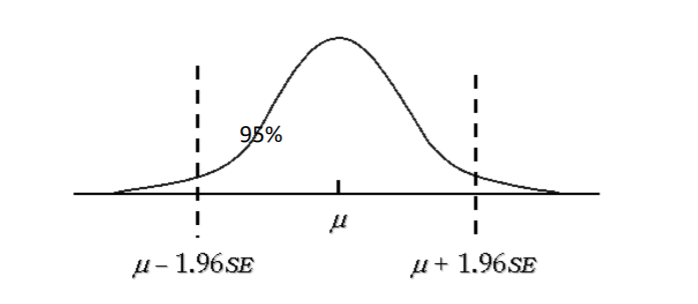
Many folks might have seen the chart on left during their annual or semi annual appraisals. So what does it say and why is it relevant. I call this a beautiful graph because it is a life saver in finding survey results and the graph is called Normal distribution and notice the dotted lines.
Imagine you have collected data points from the respondents and plotted it. If it’s a normal curve, it should look something like this graph. But wait Shatakshi, what if it doesn’t look like that ?
Well there’s a magic wand. Its called CLT: Central Limit Theorem. It says that the distribution of the sample mean (this is what you care about) – will be normal when the distribution of data in the population is normal or nearly normal which is mostly the case when computing average or mean.
CLT can be invoked
Each data point in the sample is independent of the other (last class learning)
The sample size is large enough • A sample size of 30 is usually considered large enough but there are more precise conditions, Adequate sample size depends on the distribution of data – primarily its symmetry and presence of outliers
But Shatakshi, its getting too technical and you promised otherwise. Well, yes wait. We are almost there. Assuming you took a large enough sample, you can invoke CLT and tada: there will be normal curve.
So where is the confidence in my answer ?
Now comes the cool part, you pull some fancy tool lets say JMP. Plot your data, from there you can quickly make confidence intervals.
What is confidence intervals? My question to you back would be what do you think will happen if we took another random sample with different respondents?
Thus, you rather get a range of your sample mean with certain confidence than doubtful objective answer. It is basically a range of values that you report by saying with 95% confidence that the value will be within range of [X,Y]. The confidence level can also change lets say 99%, and the range of your confidence bands would increase and scope of error would decrease as obviously you are 99% confident about the mean now. You can easily change these numbers in the software.
Now recall how GDP of the country is reported: We estimate that actual growth may have been about 4½ percent with a 95 percent confidence interval of 3 ½ -5 ½ percent.
It is basically about getting precise in your answer. Why is precision needed ? Its needed for better monitoring. Why is monitoring needed ? Because what gets monitored gets done !
This brings to The End of Lesson 2.
Note: I’m not an expert in any of these fields neither do I claim to be. MBA teaches common sense and exposes you to the science and tools that you were not aware of before. My goal is the same here and reach to people who wish to up-skill further.
If you liked this post, please click that heart icon to show it. I really appreciate it.
If you are new here and wish to know the story how MBA in 2 minutes was started, you can click here.
This is brilliant, thanks Shatakshi!
Eagerly waiting for next lesson!
Hi Shatakshi,
In the second question of this post, when you say that for a 99% confidence level "the range will squeeze in", doesn't the range actually get a little bigger, accommodating more acceptable values ?
Dear Shatakshi Sharma, I am so happy to learn concepts presented in a very simple manner. Keep educating us. Thanks